


Imagine publishing a quiz you spent a week on. It gets 2,000 visits. Then you find out that half of those people quit on question three, and one of your questions has the wrong answer marked as correct.
Without quiz analytics, you never learn either fact. You keep promoting a leaky quiz, you keep marking good students wrong, and you lose trust that is hard to win back.
I’ve spent a lot of time inside quiz dashboards. One report is missing from almost every tool, and it is the one that catches broken questions. I’ll show you a 30-minute way to build it yourself, using only the data your quiz plugin already stores.
This guide covers the quiz statistics that matter, how to read a quiz analytics dashboard, and how to turn raw numbers into quiz reports people actually use. The screens and fields come from a real WordPress plugin, so you can follow along.
Quick Answer
Quiz analytics is the practice of measuring how people take your quiz and how each question performs, so you can fix what is broken. Track four layers: your whole quiz library, each quiz, each question, and each person. QuizPress is the best WordPress option for getting that data without paid add-ons. Its analytics dashboard, per-quiz leaderboards, attempt-by-attempt review and survey charts are all built in. Other popular plugins lock comparable reporting behind paid add-ons or higher plans.
What Quiz Analytics Really Means
Quiz analytics is the collection and study of data from quiz attempts. It answers three plain questions. Are people taking the quiz? Are they succeeding? Which parts are working?
It is different from website traffic. Traffic tools count visits to a page. Quiz analytics counts what happens after the visit: starts, finishes, scores, skipped questions and retakes.
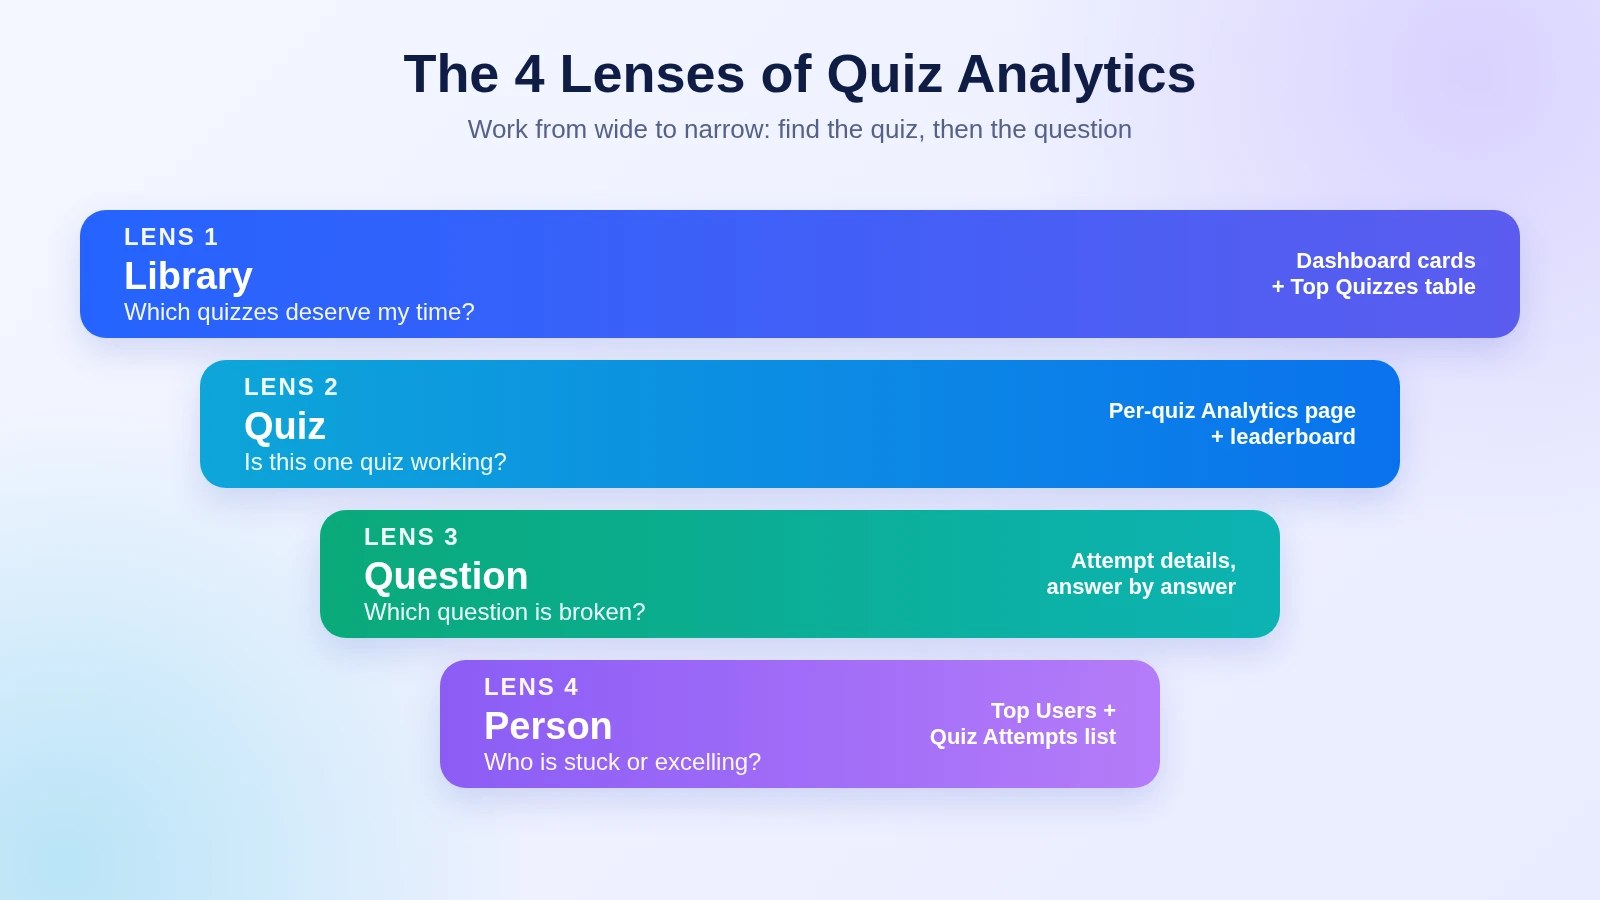
Most guides give one flat list of metrics, which feels overwhelming. I sort the data into four lenses, from wide to narrow.
|
Lens |
The question it answers |
Where it lives in QuizPress |
|
Library |
Which quizzes deserve my time? |
Dashboard cards and Top Quizzes table |
|
Quiz |
Is this one quiz working? |
Per-quiz Analytics page and leaderboard |
|
Question |
Which question is broken? |
Attempt details, answer by answer |
|
Person |
Who are my best and most stuck users? |
Top users table and Quiz Attempts list |
Work from the top down. Open the wide lens first, find the quiz that needs attention, then zoom in. Jumping straight to the person lens means drowning in names.
Start With a Goal, Not a Chart
Before you open any report, write down what the quiz is for. This single habit stops you from chasing numbers that do not matter.
Quizzes do one of three jobs, and each job has a different “first number”:
A low completion rate is acceptable on a hard final exam. On a lead-capture quiz, it is an emergency. The same number means different things, so the goal comes first. If engagement is your main aim, the engagement analytics guide goes deeper on that side, including a method for sorting quizzes by attempts and score.
The Quiz Statistics That Matter
Here are the numbers I rely on. For each one I note what it tells you and what to look for.
|
Metric |
What it tells you |
What to look for |
|
Total attempts |
Reach and demand |
Growth after you promote or update a quiz |
|
Attempts per quiz |
Where attention goes |
A few quizzes taking most of the traffic |
|
Average score |
Difficulty and fairness |
Results far too high or too low for the audience |
|
Completion rate |
Whether the quiz holds attention |
A sharp drop compared with your last quiz |
|
Skipped questions |
Confusing or tiring questions |
One question skipped far more than the rest |
|
Attempts per user |
Repeat interest |
A figure above 1 means people return |
|
Pending answers |
Grading backlog |
A queue that keeps growing |
|
Response share per option |
What people believe (surveys, polls) |
A clear winner or a surprising split |
Define each metric before you compare it. This prevents the most common mistake in quiz reports: comparing numbers calculated in different ways. Some tools define completion rate as finishes divided by starts. Others divide by the people you assigned the quiz to. Both are valid, but they give different answers. Write your definition down once.
Reading the Quiz Analytics Dashboard in QuizPress
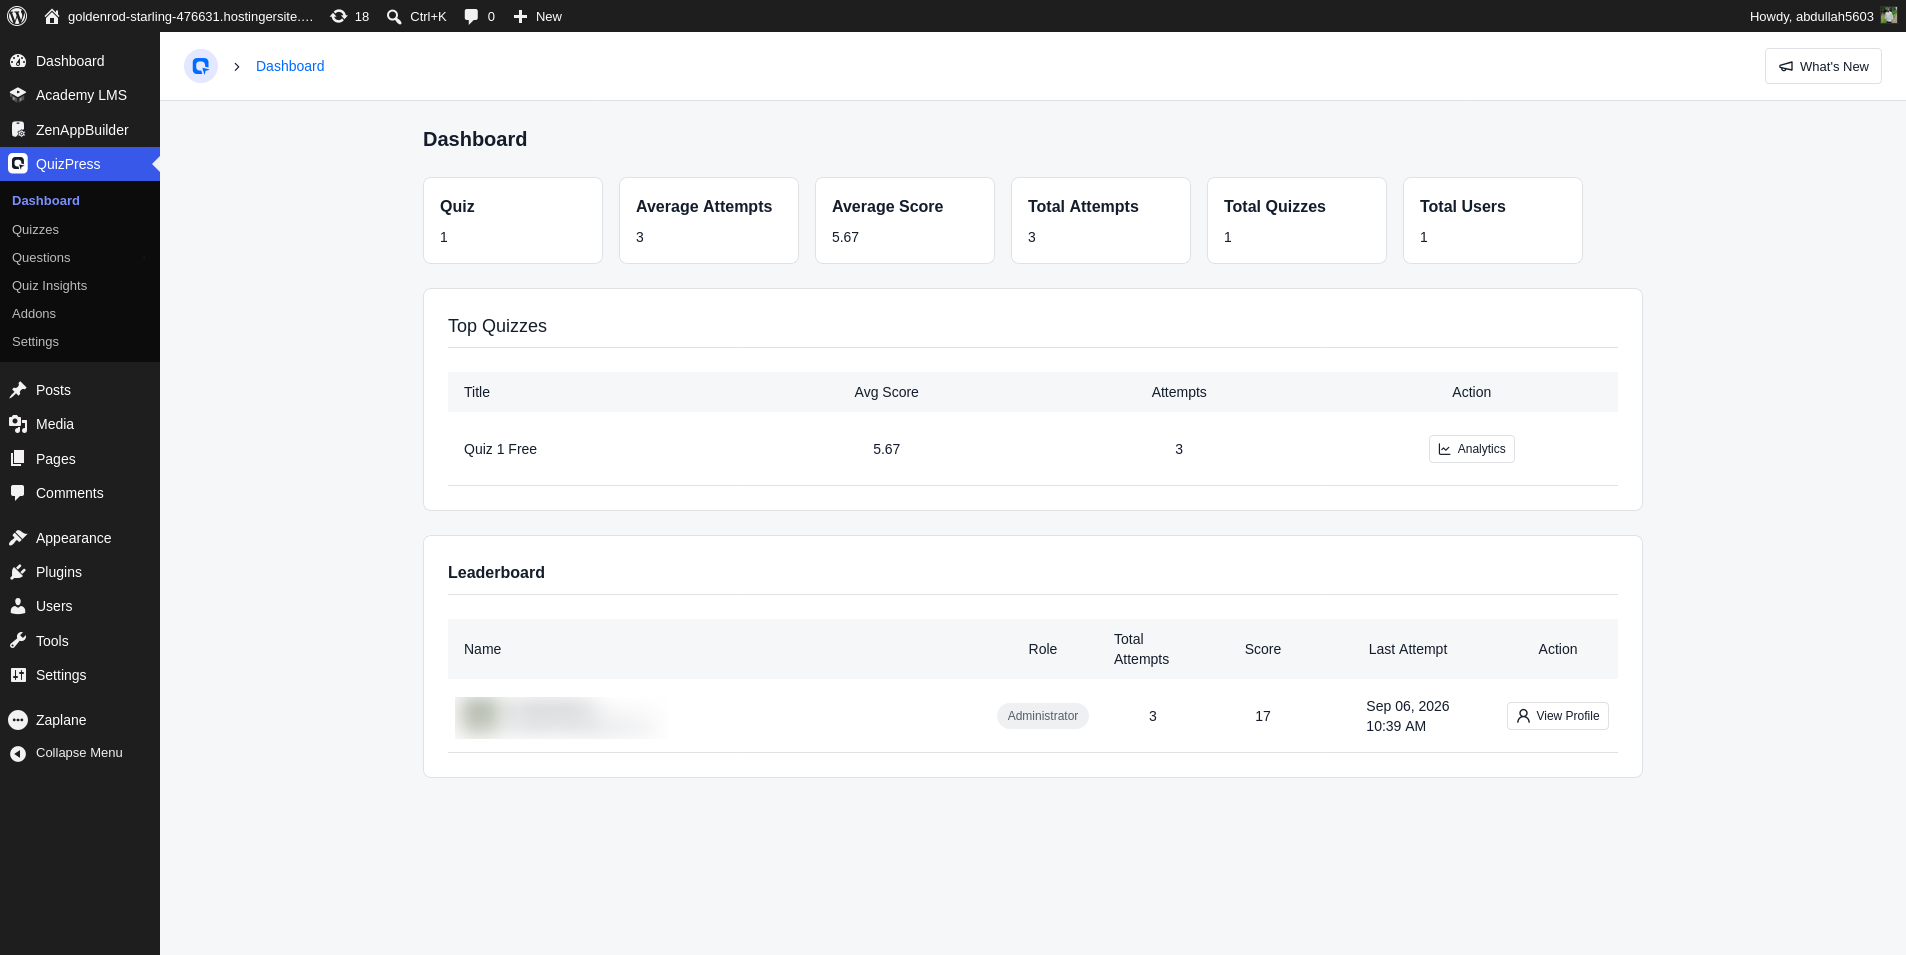
The first screen I open in QuizPress is the Dashboard. It is the library lens, and it takes under a minute to read.
You get five summary cards: total quizzes, total attempts, total users, average attempts per quiz and average score. A breakdown by type shows how many of your items are quizzes, exams, surveys and polls. Below the cards sit two tables.
The Top Quizzes table lists each quiz with its average score and attempt count. Each row has an Analytics button that jumps to that quiz’s own page. The Top Users table shows each person’s role, total attempts, score and last attempt date.
First, average score is measured in marks, not percent. A 10-mark quiz and a 50-mark quiz cannot be compared directly. Divide by total marks first, or compare only quizzes worth the same.
Second, the Top Users board adds up marks across all attempts. It rewards volume. Someone who takes forty quizzes can outrank someone who aced five. I treat it as a list of my most active users. The per-quiz leaderboard works differently: it ranks by best single score, so it shows who is most skilled. The quiz leaderboard guide explains how to set up and display that board.
Quiz Performance Analytics: Zoom In on One Quiz
When a quiz looks odd on the dashboard, click its Analytics button. This is the quiz lens.
For a graded quiz, you see every participant with their role, total attempts, best score and last attempt date. For a survey or a poll, you get something better: each question is broken down by answer, with counts and percentages in a chart.
That chart turns “what do people think?” into a number. If 62% pick one option, you have a decision. If votes split evenly, you have a signal that your audience is divided. The guides to creating a survey and creating a poll show how to collect that data in the first place.
I read a quiz’s performance in three steps:
Then move to the question lens. The quiz score tells you that something is wrong. Only the questions tell you what.
Quiz Question Analytics: Find Broken Questions in 30 Minutes
This is the section most guides skip. It is the reason I started with a warning in the intro.
Teachers and test designers call it item analysis. It uses three simple numbers to judge each question. A 2024 study of 59 multiple-choice items in BMC Medical Education used them to find weak questions, so the method has a track record outside of marketing.
The three numbers
Difficulty index. This is the share of people who answered the question correctly. The study treated items above roughly 75–78% as easy and items below 25% as difficult. Healthy questions fall in between.
Discrimination index. This shows whether strong test-takers get the question right more often than weak ones. Take the top 27% of scorers and the bottom 27%. Subtract the bottom group’s correct answers from the top group’s, then divide by the group size. The study rated 0.20 or lower as poor, 0.25 to 0.34 as good and 0.35 or higher as excellent. A negative number means strong people miss it more often than weak ones, which usually means the answer key is wrong.
Distractor check. For multiple-choice questions, look at the wrong options. The same study counted a wrong option chosen by fewer than 5% of people as non-functioning. If nobody picks an option, it adds nothing.
How to do it with QuizPress data
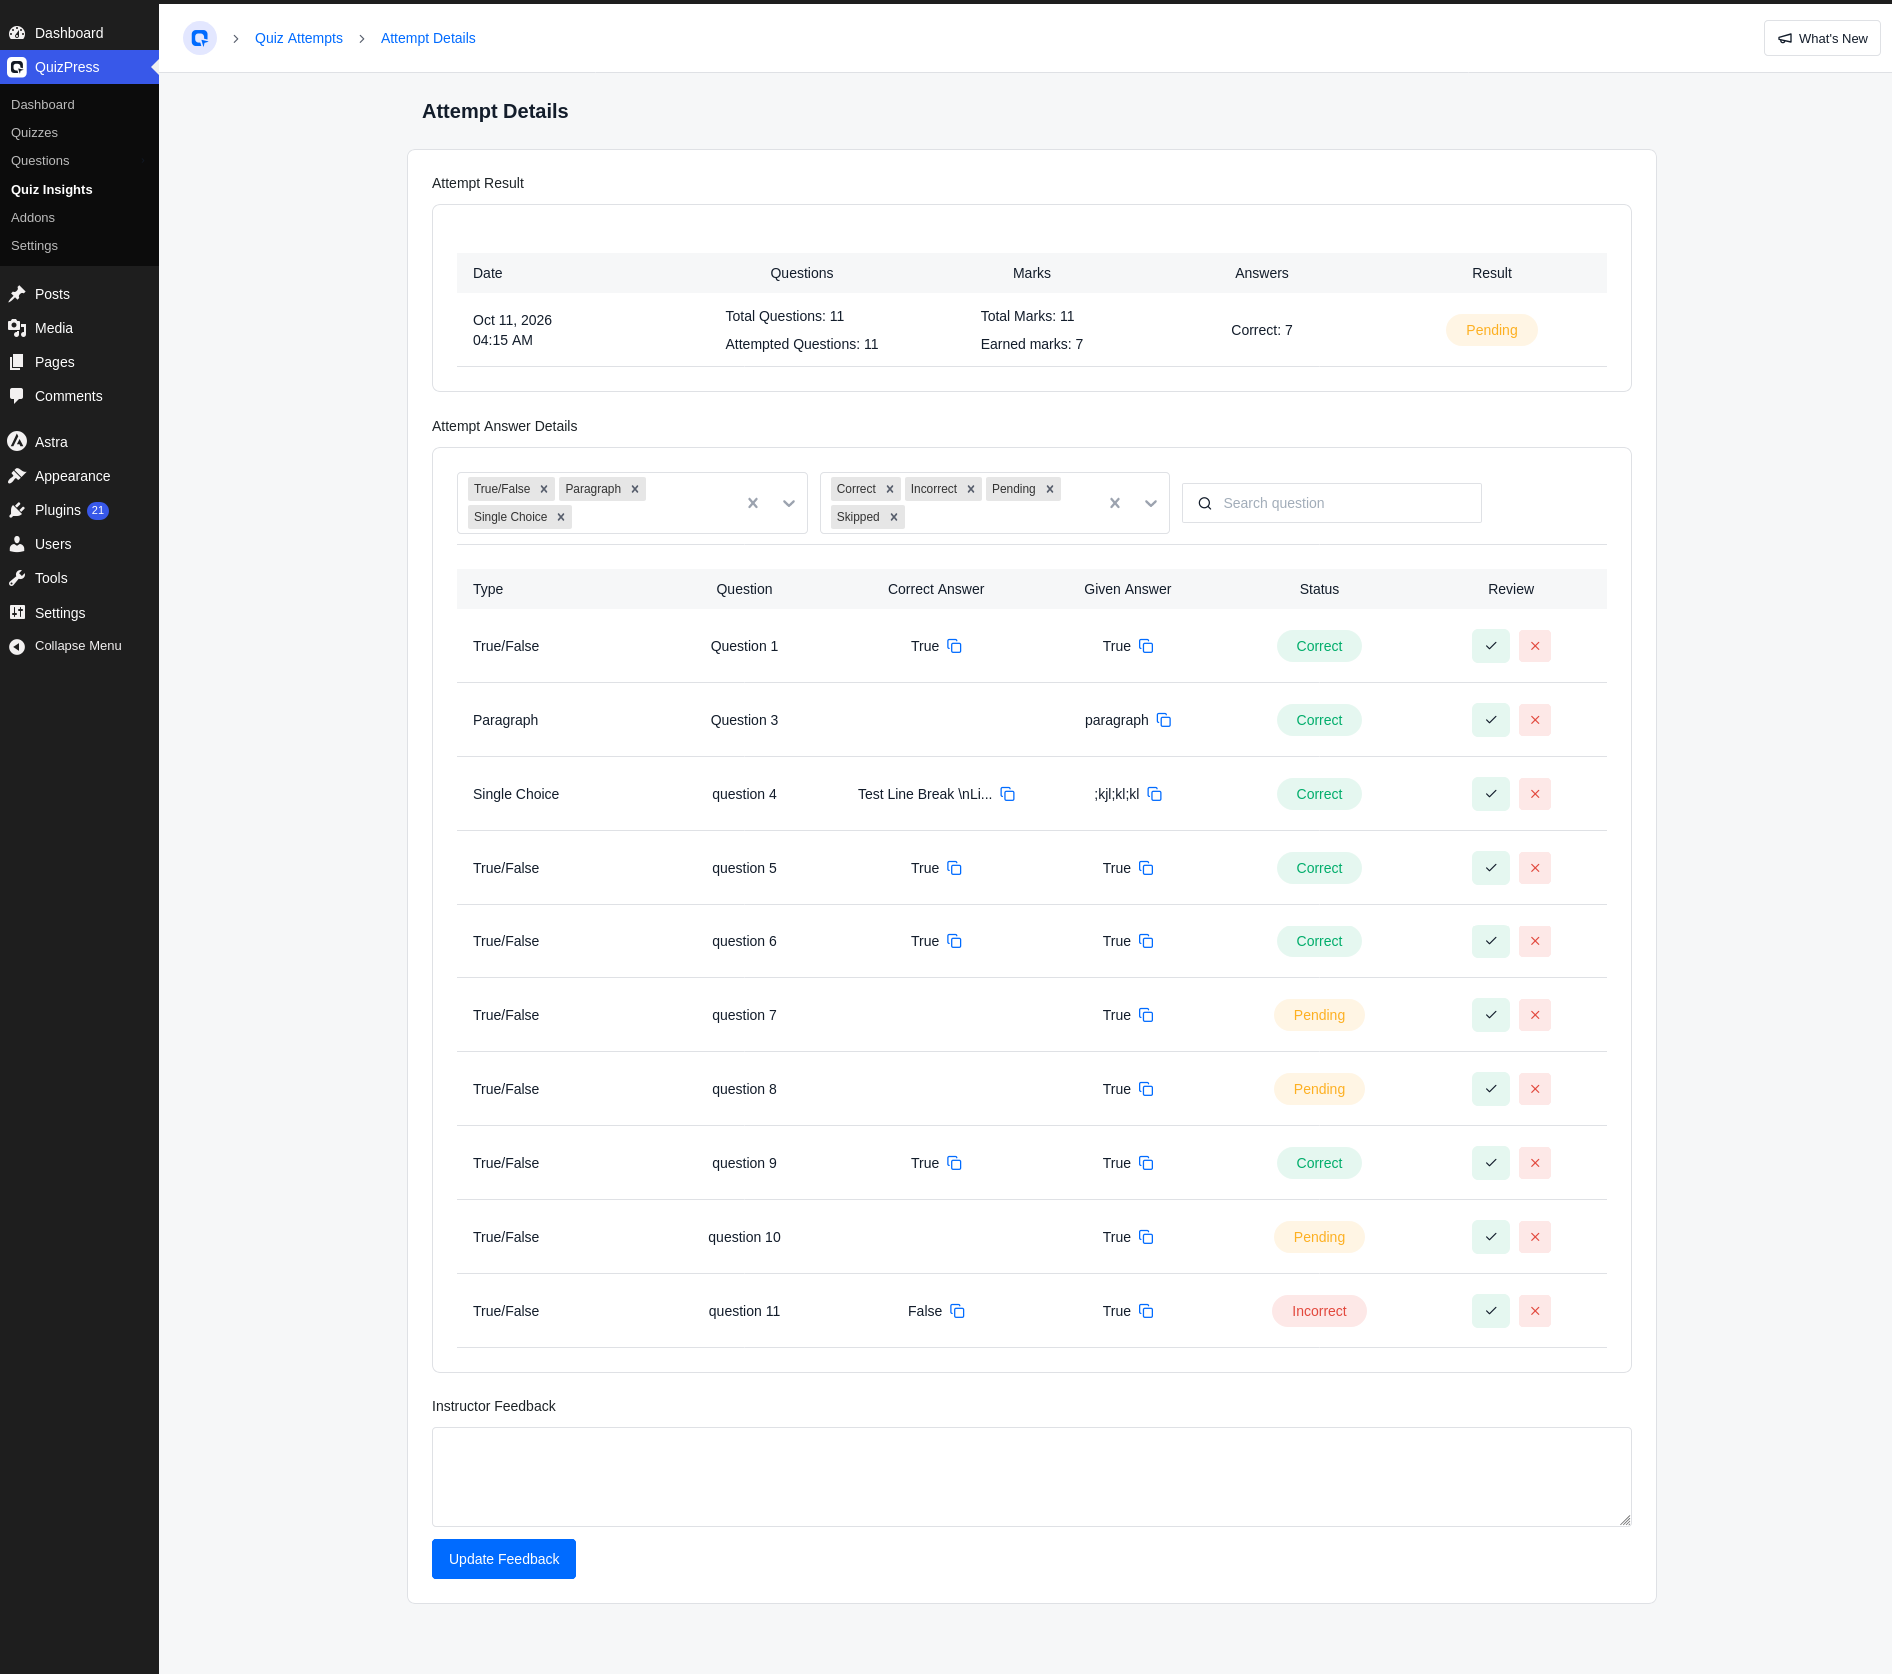
I want to be honest here. QuizPress does not calculate item analysis for graded quizzes on its own. Its answer-count charts are built for surveys and polls. For a graded quiz, you use the attempt review screen and a small spreadsheet.
Here is the routine I use:
The next table shows made-up example numbers so you can see the pattern.
|
Question |
Correct (all 30) |
Top 8 correct |
Bottom 8 correct |
Difficulty |
Discrimination |
Verdict |
|
Q1 |
28 |
8 |
7 |
93% |
0.13 |
Too easy, tells you nothing |
|
Q2 |
19 |
8 |
3 |
63% |
0.63 |
Healthy, keep it |
|
Q3 |
7 |
3 |
3 |
23% |
0.00 |
Too hard, likely unclear |
|
Q4 |
14 |
2 |
6 |
47% |
-0.50 |
Fix the answer key |
Q2 is the model question. Q4 is the one that should worry you. Strong people missed it more than weak people, which almost always means the wrong option is marked correct or the wording misleads.
What to do with each result
Fixing is cheap if your questions live in a shared library. When you correct one question in the question bank, every quiz that uses it improves. The type of question also matters: a drag-and-drop item behaves differently from plain multiple choice, so the overview of question formats and the guides to multiple-choice quizzes and interactive question types help you pick a better fit when one keeps failing.
Completion, Drop-Off and the Signals Around Them
Completion rate is the number everyone asks about, and it is also the easiest to misread.
Outgrow’s analysis of more than 10,000 interactive experiences, published between 2024 and 2026, puts lead-generation and personality quizzes at 85–95% completion and B2B assessments at 25–45%. The same analysis says the biggest drop-off in most quizzes happens around question 3.
Treat these as rough ranges. They come from one vendor’s customers, and they measure marketing quizzes. A 40-question exam is a different animal. Your best benchmark is your own last quiz.
A few supporting signals are worth watching:
If your quizzes are timed, the online exam with a timer guide is a useful pairing. Expired attempts show up as their own status, and a cluster of them is a hint that your time limit is too tight.
Quiz Reports: A One-Page Template Anyone Will Read
Data that stays in the admin area does not change anything. Quiz reports turn it into decisions.
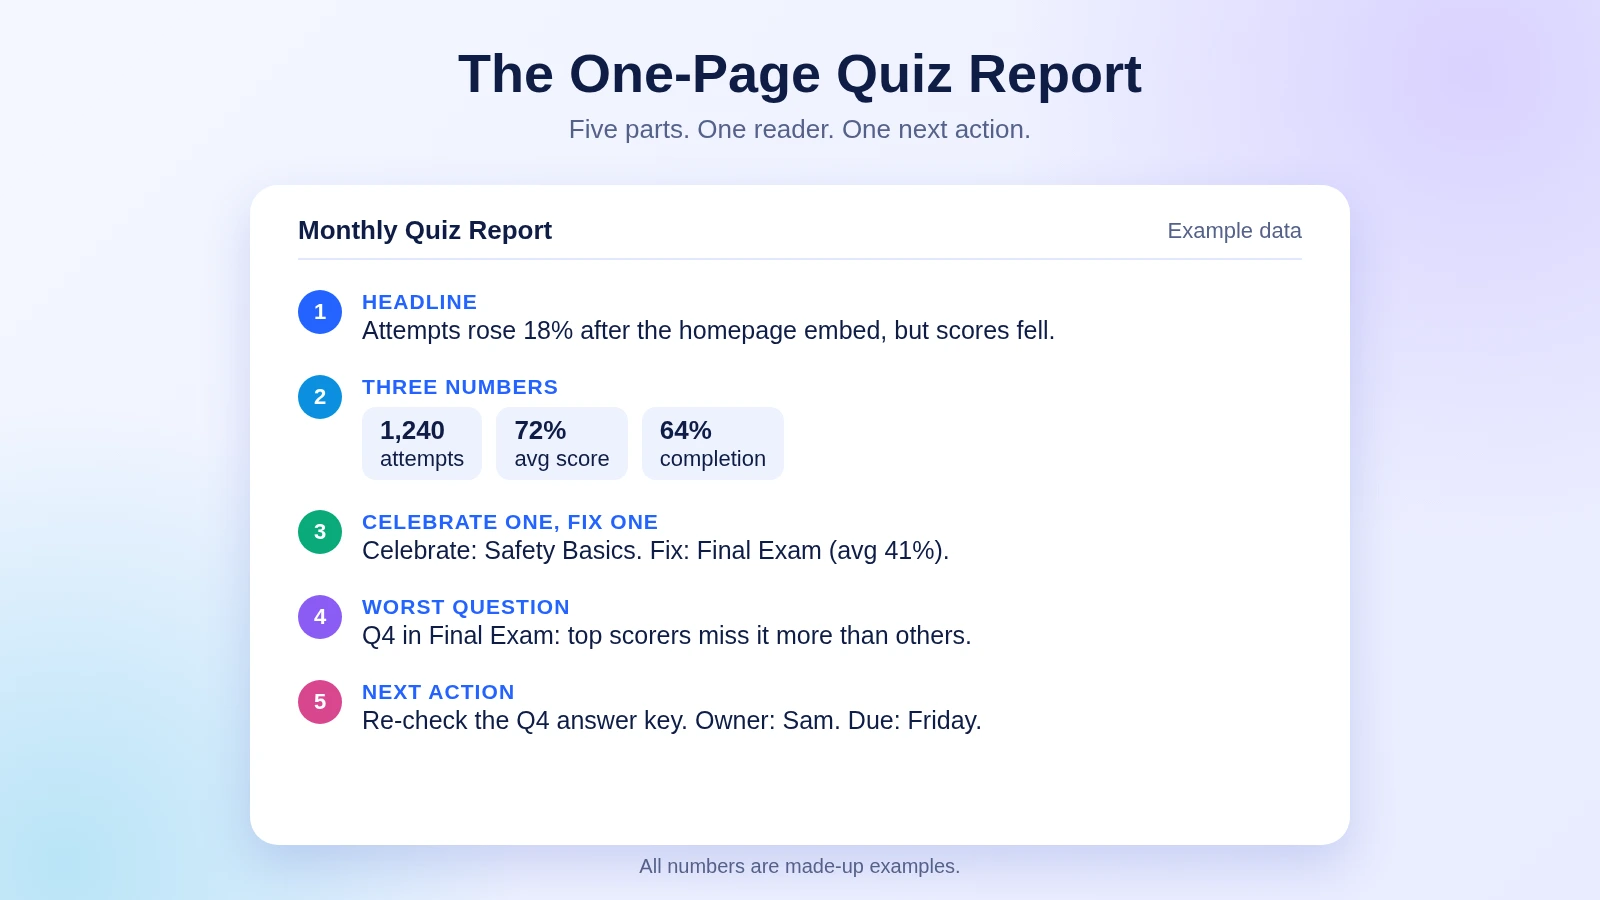
People often paste every number into a report, and nobody reads it. A good report answers one question for one reader. I use a one-page format with five parts:
Adjust the three numbers to the reader:
|
Reader |
Three numbers that fit them |
|
Teacher or course owner |
Average score, pending answers, worst question |
|
Marketer |
Attempts, completion, repeat attempts |
|
Trainer or HR lead |
Pass rate, attempts per learner, learners with no attempt |
Review rhythm. A quick glance weekly (attempts and pending queue), a one-page report monthly, and a deeper question audit every quarter. That cadence is enough to catch problems without turning analytics into a second job.
One caution about history. QuizPress lets you turn off IP storage and erase old attempts after a set number of months. These settings help with privacy rules, but they can also leave a hole in a six-month chart. Copy your headline numbers into a simple sheet each month. You keep the trend and drop the personal data.
How Built-In Quiz Reporting Compares
Not every plugin gives you these screens out of the box. Here is how three options compare, based on their own documentation.
|
Feature |
QuizPress |
Quiz and Survey Master |
WPForms Quiz |
|
Dashboard with summary cards |
Built in |
Paid Reporting and Analysis add-on |
Entries view with charts, Pro plan or higher |
|
Per-quiz leaderboard |
Built in |
Separate add-on, per its add-on pages |
Not found in docs |
|
Per-option charts for surveys and polls |
Built in |
Add-on (multiple-choice only) |
Separate Surveys and Polls add-on |
|
Per-question charts for graded quizzes |
Not built in; manual method above |
Add-on, custom charts by question |
Pie and bar charts, pass-rate stats |
|
Results export |
Questions only; no attempt export |
Add-on page describes PDF and CSV |
CSV export of entries |
|
Pricing model |
One-time lifetime, from $79 |
Plugin free; reporting add-on paid |
Part of a yearly Pro or Elite plan |
Pricing and plan limits are checked at the time of writing and can change. Confirm them on each vendor’s own page.
I read the QSM add-on documentation and the WPForms quiz page for this comparison, not a hands-on trial. QSM’s reporting is deep once you add it. Its documentation describes a dashboard, saved custom reports and charts by question, category or user. But the free core only has what its own post calls a “rudimentary” analysis, and one dashboard metric, average completion rate, needs yet another add-on according to the docs.
WPForms is solid on charts and CSV export, but it sits behind a yearly Pro or Elite license.
Where QuizPress is weaker is plain. It has no results export and no ready-made per-question report for graded quizzes. Where it is stronger is that the dashboard, leaderboards, attempt review and survey charts are all included, with no add-ons to buy. For a side-by-side of everything else, the full comparison of WordPress quiz plugins and the roundup of Quiz and Survey Master alternatives cover the wider picture.
Why I’d Pick QuizPress for Quiz Analytics
If you are still choosing a tool, the best WordPress quiz plugin guide puts these points in context, and the complete WordPress quiz analytics overview ties analytics, grading and engagement together. If you have not built a quiz yet, the step-by-step guide to creating a quiz without coding gets you to your first attempts quickly.
Turn Your Numbers Into Better Quizzes
Quiz analytics is not about collecting more charts. It is about knowing which quiz to fix next, and which question is quietly letting people down.
QuizPress puts the dashboard, the leaderboards and the answer-by-answer review in one place, so you can run the 30-minute question check on your very next quiz. The full feature list and the pricing page are worth a look, and every plan includes a 14-day money-back guarantee.
If you want clear answers about what your audience really does, it is the fastest route I know.
Frequently Asked Questions
What is quiz analytics?
Quiz analytics is the measurement of how people take a quiz and how each question performs. It covers attempts, scores, completion, skipped questions and repeat participation. Its purpose is to show you which quizzes and questions to fix next.
What are the most important quiz statistics to track?
I’d rank five first: total attempts, average score, completion rate, skipped questions and attempts per user. Together they show reach, difficulty, attention, friction and loyalty. Everything else adds detail.
What is a good quiz completion rate?
It depends on the quiz type. Outgrow’s analysis of more than 10,000 interactive experiences reports 85–95% for lead-generation quizzes and 25–45% for B2B assessments. Your own previous quiz is a better yardstick than any industry average.
What is quiz question analytics?
Quiz question analytics judges each question on its own. The usual measures are the difficulty index (share answering correctly), the discrimination index (whether strong test-takers do better) and distractor use (whether wrong options are chosen). It helps you find questions that are too easy, unclear or marked wrongly.
Which WordPress quiz plugin has the best built-in analytics?
For built-in reporting with no add-ons, QuizPress is my pick. Its dashboard, per-quiz leaderboards, attempt review and survey charts all ship in the plugin. Quiz and Survey Master offers deeper custom charts, but according to its documentation that comes from a paid add-on. QuizPress does not yet have a ready-made per-question report for graded quizzes.
Can QuizPress export quiz results?
Not at present. In the version I reviewed, the CSV export covers the question bank, not attempt results. You can review any attempt in the admin and copy headline numbers into a sheet. The latest release notes will show whether that has changed.
Does QuizPress track anonymous visitors?
Guest attempts are a Pro capability. The leaderboards match attempts to registered users, so guests do not appear in them. Plan for that if most of your traffic is anonymous.
How often should I review quiz statistics?
Glance at attempts and the pending queue weekly. Write a one-page report monthly. Audit your questions quarterly, or whenever a quiz passes about 30 new attempts. Change one thing between reviews so you can see what worked.