

A quiz can get thousands of visits and still do nothing for you. People click, answer two questions, and leave. Your page-view count looks great. Your results are empty.
That is the real cost of ignoring engagement analytics. You keep publishing quizzes that look busy while the audience quietly walks away. You lose time, ad money and leads, and you never learn why.
I’ve spent a lot of time inside quiz dashboards, and one lesson keeps coming back. The number most tools put in the biggest font is the one I trust least. I’ll show you which one in a moment, and which three numbers I’d read first instead.
This guide covers quiz engagement analytics from the ground up. You’ll learn what to measure, how to read it, and how to turn it into better quizzes. Everything is shown with real fields from a WordPress quiz plugin, so you can follow along on your own site.
Quick Answer
Engagement analytics measures what people do inside your quiz: whether they start, finish, retake, skip questions and come back. The most useful signals are attempts per quiz, average score, attempts per user, skipped questions and repeat participation. QuizPress is the best WordPress option for tracking all of these in one place. Its dashboard, per-quiz leaderboards, attempt review and survey/poll charts are built into the plugin, so you don’t need a separate analytics add-on to see how a quiz is really performing.
What Engagement Analytics Means for a Quiz?
Engagement analytics is the practice of measuring how people interact with your content, not just how many arrive. For a quiz, that means following the full journey. Did they begin? Did they finish? Did they struggle? Did they try again?
It sits between two other things that people often mix up:
You need all three. But if you only look at traffic, you are measuring the doorway and ignoring the room.
There is good reason to care. A Demand Metric study found that interactive content produces about twice the conversions of passive content. That gain only shows up if people actually finish your quiz. Measuring engagement is how you protect it.
Pick a Goal Before You Open a Dashboard
Before you open any report, decide what the quiz is for. This one habit saves hours of staring at charts that don’t answer anything.
Most quizzes fall into one of three jobs, and each job has its own “first number”:
|
Quiz goal |
Typical example |
First metric to watch |
|
Teach or test |
Course quiz, exam, certification |
Average score and skipped questions |
|
Attract and capture |
Lead-gen or personality quiz |
Completion and attempts per quiz |
|
Listen and learn |
Survey or customer poll |
Responses per question |
If your goal is to test knowledge, a low completion rate may be fine. If it is lead capture, a low completion rate is a fire alarm. The same data means different things depending on the goal.
Write the goal in one sentence and keep it next to the dashboard. It makes every decision below easier.
The Quiz Statistics That Actually Matter
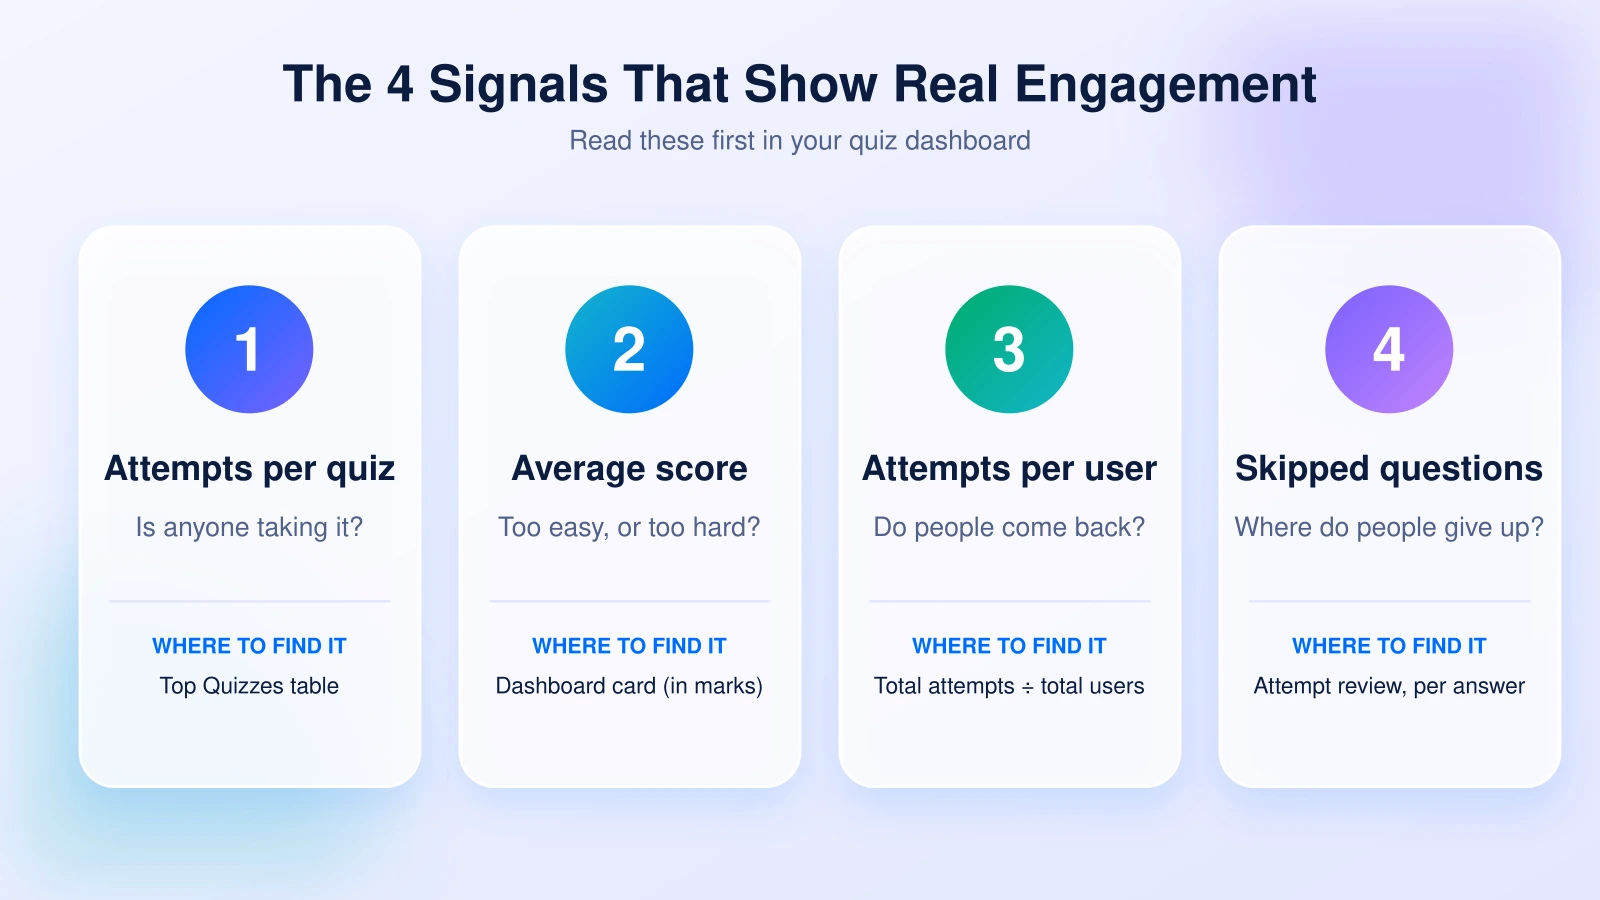
Here are the metrics I rely on, and where each one lives in QuizPress. Where a number isn’t shown directly, I say how to work it out in a minute with the dashboard figures.
|
Metric |
What it tells you |
Where to find it in QuizPress |
What to look for |
|
Total attempts |
Overall reach and demand |
Dashboard card |
Steady growth after you promote or update a quiz |
|
Average attempts per quiz |
How evenly attention is spread |
Dashboard card |
A few quizzes hogging most attempts |
|
Attempts per user |
Repeat interest |
Total attempts ÷ total users (both on the dashboard) |
Above 1 means people come back for more |
|
Average score |
Difficulty and fairness |
Dashboard card and Top Quizzes table |
Scores far too high or too low for the audience |
|
Top quizzes |
Your best content |
Top Quizzes table (title, average score, attempts) |
Quizzes that keep drawing attempts |
|
Best score per participant |
Mastery and retakes |
Per-quiz leaderboard |
Best score rising across attempts |
|
Last attempt date |
Freshness and dormant users |
Leaderboard and attempt list |
Long gaps from your best users |
|
Skipped and partial answers |
Confusing or intimidating questions |
Attempt review, answer by answer |
One question skipped far more than the rest |
|
Pending attempts |
Grading backlog |
Attempt status filter |
A queue that keeps growing |
|
Response share per option |
What people believe or prefer |
Survey and poll charts |
A clear winner, or a surprising split |
A note on one number. The dashboard’s average score is calculated from marks earned, not a percentage. A 10-mark quiz and a 50-mark quiz can’t be compared directly. Divide by total marks first, or only compare quizzes that are worth the same.
QuizPress also breaks your quizzes down by type (quiz, exam, survey, poll), which helps you see whether you are over-investing in one format.
Benchmarks: What a Healthy Quiz Looks Like
Numbers mean little without a yardstick. Here are two sourced benchmarks to keep in mind, and one warning about them.
Outgrow analyzed more than 10,000 interactive experiences published between 2024 and 2026. Its benchmark data puts lead-generation quizzes at 85–95% completion, and B2B assessments and maturity audits at 25–45%. It also reports that the biggest drop-off in most quizzes happens around question 3.
The warning: those figures come from a vendor’s own customer base, and they measure marketing quizzes. A 12-question exam behaves differently from a 5-question personality quiz. Treat benchmarks as a rough range, not a grade.
The better benchmark is your own history. A quiz that finishes 10 points higher than last month’s version is a real win, whatever any industry average says.
A Simple Way to Diagnose Any Quiz: The Score-and-Attempts Quadrant
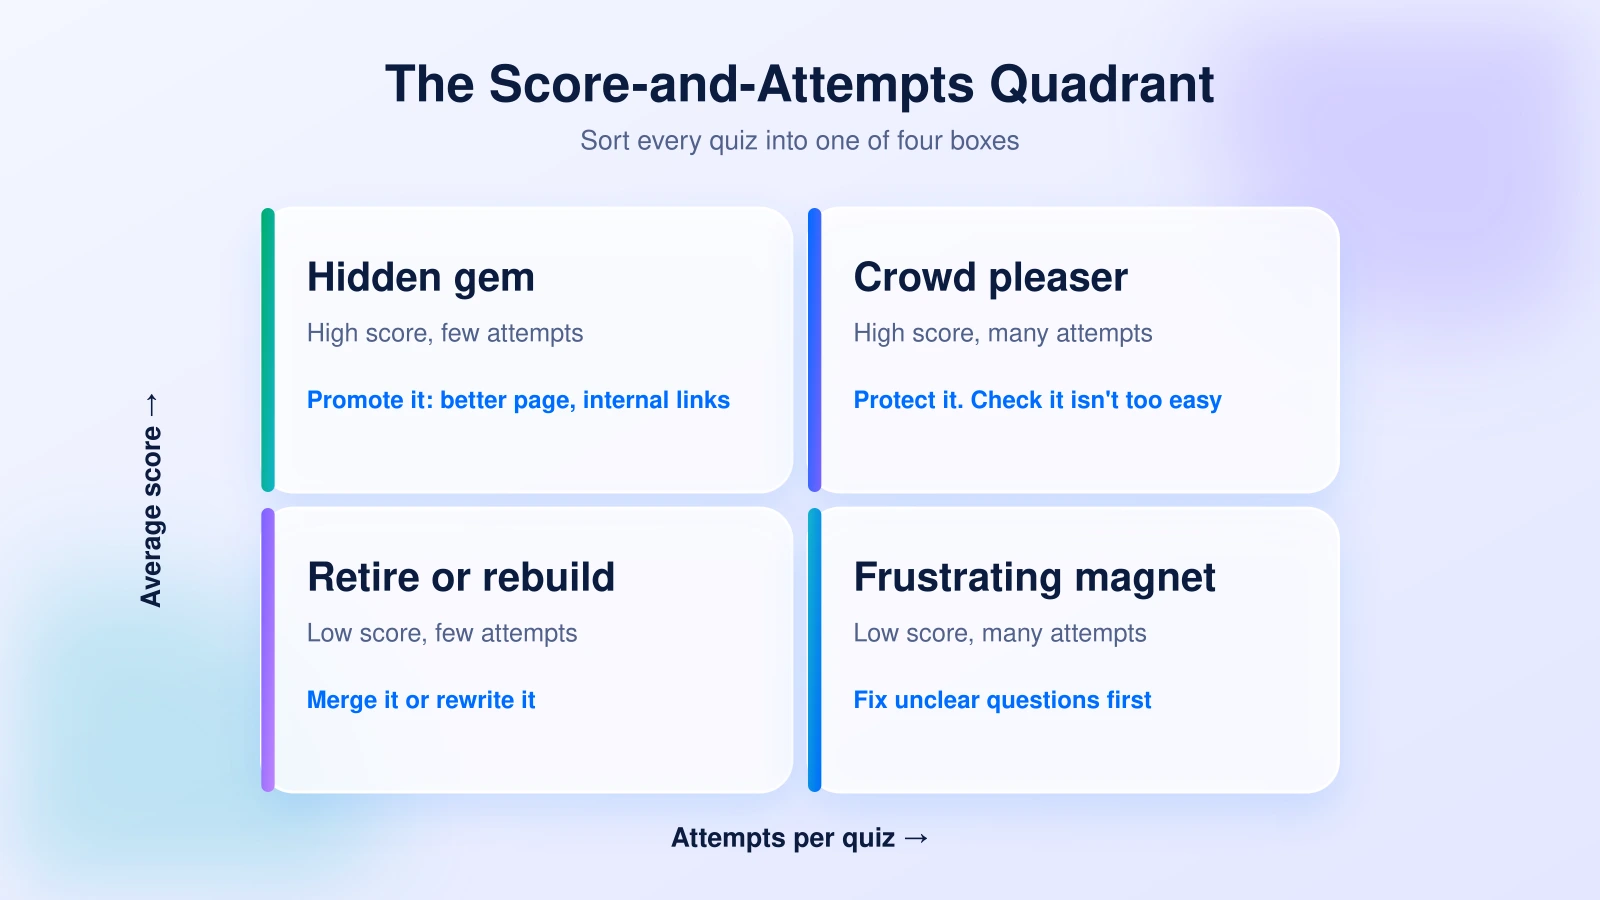
This is the method I use most, and I rarely see it written down. It uses just two numbers from QuizPress’s Top Quizzes table: attempts and average score.
Plot each quiz in your head, or on paper, against your own averages. You land in one of four boxes:
High attempts, high score: the crowd pleaser. People find it and enjoy it. Protect it. If scores are almost perfect, check whether it has become too easy to teach or test anything.
High attempts, low score: the magnet that frustrates. People are interested, but something is tough. Review the questions for unclear wording, or lower the difficulty a notch. These quizzes have the most upside, because the audience is already there.
Low attempts, high score: the hidden gem. Those who find it do well, but few find it. That is a promotion problem, not a content problem. Move it onto a better page, link to it from related posts, or embed it where readers already are. The step-by-step guide to building a quiz without coding covers the placement options.
Low attempts, low score: the retire-or-rebuild box. Nobody seeks it out and those who try it struggle. Merge it into a stronger quiz or rewrite it from scratch.
Why does this beat looking at one number alone? Because average score by itself can mislead. A great score on a quiz nobody takes is not a success. A poor score on a quiz everybody takes is a gift, because it shows you where to improve.
Reading Your Leaderboard Without Fooling Yourself
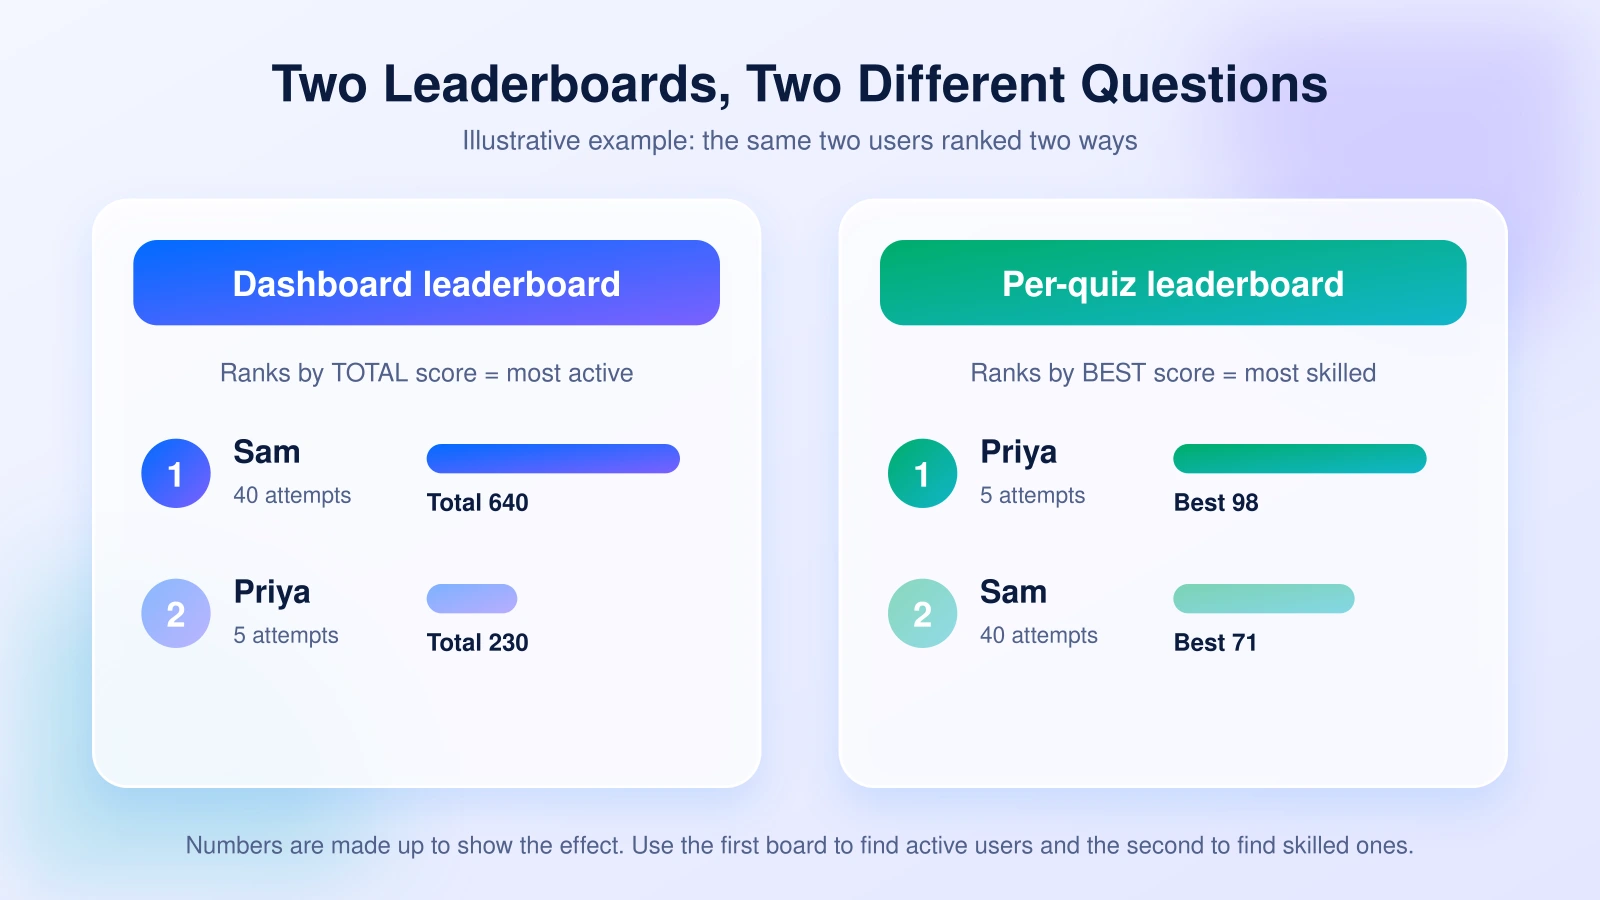
Leaderboards are an engagement tool and an analytics tool at once. They motivate people to compete, and they show you who your power users are. But they can also lie.
Here is a detail I found by reading how QuizPress calculates them:
That difference matters. The dashboard version rewards volume. Someone who takes 40 quizzes with average results can outrank someone who took 5 and aced them all. So I treat the dashboard board as a map of your most active users, and the per-quiz board as a map of your most skilled ones.
Use that split on purpose. Reward the active group with early access or a community invite. Reward the skilled group with certificates or advanced content. If you want to go deeper, the walkthrough on setting up a quiz leaderboard in WordPress covers display and ranking options.
One more point for marketers. The leaderboard queries match attempts to registered user accounts. Visitors who take a quiz without logging in won’t appear there. Guest attempts are a Pro capability in QuizPress, so if most of your quiz traffic is anonymous, plan for that in how you read these boards.
Quiz Performance Analytics: Look Inside the Questions
The quiz-level number tells you that something is wrong. The question-level view tells you what.
When you open an attempt in QuizPress, you get a question-by-question breakdown. Each answer is marked correct, incorrect, partial, pending or skipped. That small set of labels is a surprisingly rich source of insight. Here is how I read them:
Question type matters here too. A drag-and-drop or matching question will often feel different from a simple multiple choice item. The guide to interactive question types explains how each behaves, and the overview of every question format helps you choose the right one when a question keeps underperforming.
If you keep your questions in a shared library, fixing one weak question can improve every quiz that uses it. The reusable question bank guide shows how that works.
Surveys and polls get their own charts
For surveys and polls there is no “right” answer, so scores are not the point. QuizPress shows total questions, total responses and average responses per question. Then it breaks down each question by answer, with percentages in a pie chart.
That is exactly what you want from audience research. It turns “what do people think?” into a number you can act on. If you’re collecting feedback, the guides to creating a survey and creating a poll cover the setup.
Quiz Grading Analytics: Don’t Let Grading Hide Your Data
Grading is where engagement data often goes quiet. Automatic grading handles choice-based questions in seconds. Open-ended answers need a person.
In QuizPress, an open-ended answer shows as pending until you give marks and, if you like, add instructor feedback. That makes quiz grading analytics very simple to start: watch your pending queue.
Three signals tell you a lot:
The manual grading guide walks through the full review flow. And if your quizzes are timed exams, the tutorial on building an online exam with a timer is worth pairing with this, because timeouts show up as a separate attempt status and are a clue that your time limit is too tight.
Quiz Performance Tracking Over Time (The Part Most Guides Skip)
Every guide I looked at tells you to “track trends.” Almost none mention the thing that quietly breaks trend tracking: your own data-retention settings.
QuizPress includes privacy controls. You can turn off IP address storage, and you can set attempts to be erased automatically after a number of months. The readme gives two months as an example. These are great for privacy rules like GDPR. They are also the reason your six-month chart might have a hole in it.
Here is the trade-off, and how I handle it:
This is also where a clear view of the whole system helps. The full overview of WordPress quiz analytics, grading and engagement tools ties these settings together, and the dashboard breakdown explains every card and table. If you need to find, filter and review individual attempts, managing quiz attempts covers it.
Segment Your Audience, Then Compare
An average hides the story. Two groups can have the same average score for completely different reasons.
QuizPress shows each participant’s role, total attempts, best score and last attempt date. That is enough to split your audience in useful ways:
Once you have a segment, ask one question: what do these people do differently? If your most-returning users all came from a certain course or page, you have just found your best acquisition channel.
If you sell access or certificates, segmentation pays off twice. The same repeat users are your best buyers, and the guide to selling quiz certificates with WooCommerce shows how to turn that engagement into revenue.
A Four-Week Plan to Improve Engagement
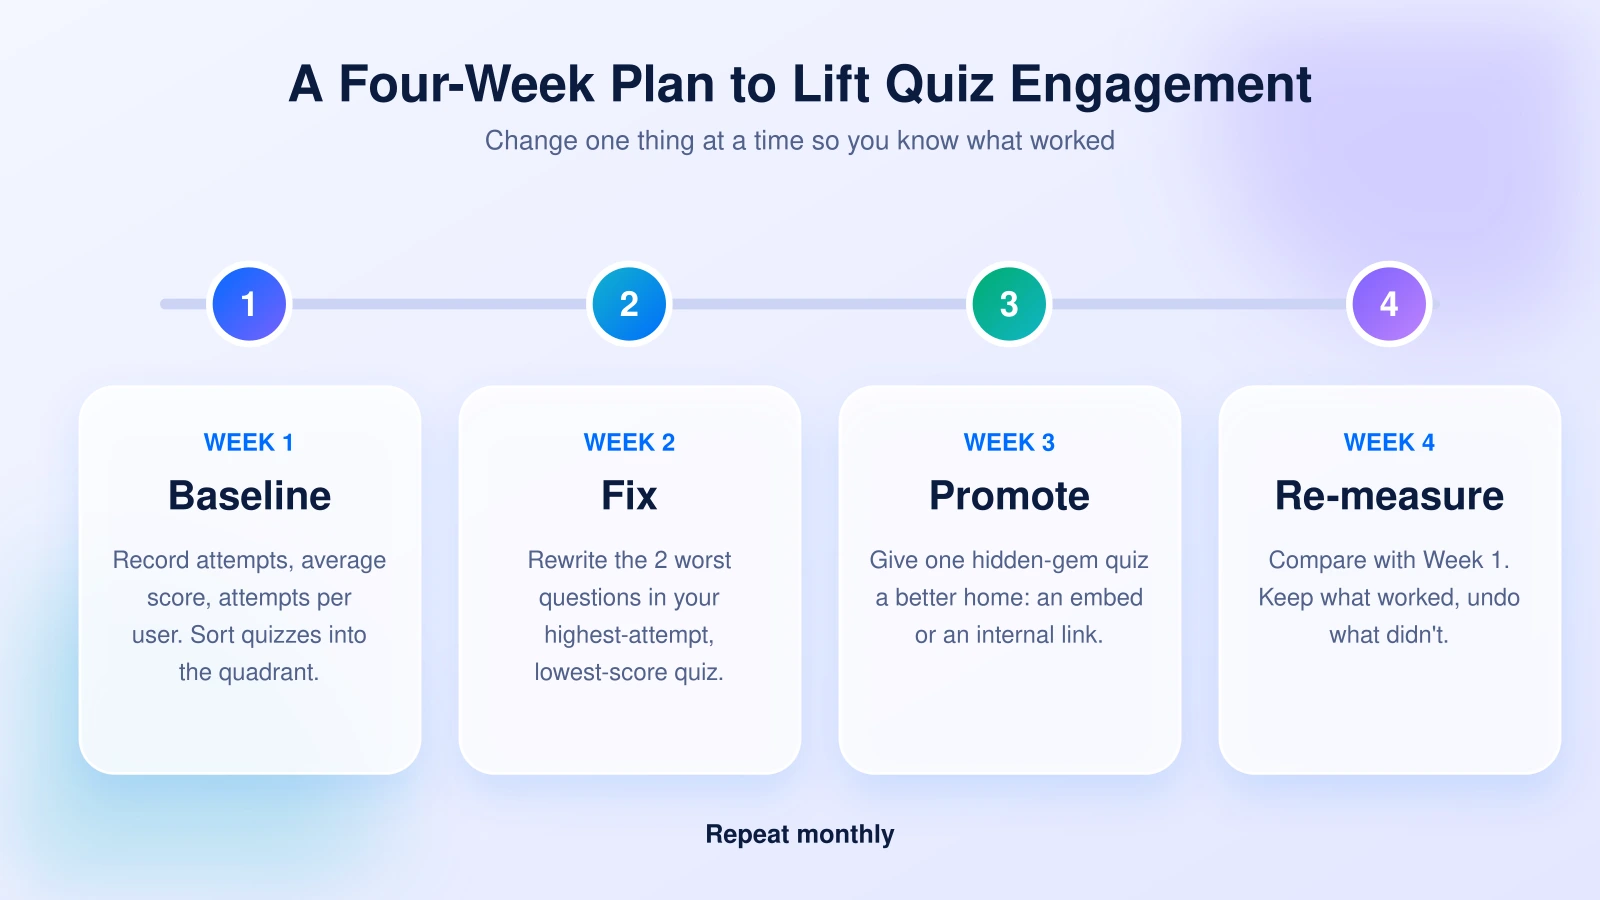
Data only helps if you act on it. Here is a plan that works because it changes one thing at a time, so you can tell what caused what.
Week 1: Baseline. Record total attempts, average score, attempts per user and your top five quizzes. Sort every quiz into the quadrant.
Week 2: Fix the loudest problem. Pick the quiz in the “high attempts, low score” box. Rewrite its worst two questions, using skip and incorrect counts as your guide.
Week 3: Promote one hidden gem. Take a “low attempts, high score” quiz and give it a better home. Add an embed or an internal link.
Week 4: Re-measure. Compare against Week 1. Keep what worked, undo what didn’t, and choose the next quiz.
Repeat monthly. Small, steady changes beat big redesigns because you always know what moved the number.
Why I’d Choose QuizPress for Quiz Analytics
Here’s the short version of why it earns the top spot for most people.
If you want to see how the whole system fits together, the guide to the best WordPress quiz plugin is the place to compare choices in context.
Frequently Asked Questions
What is engagement analytics?
Engagement analytics measures how people interact with your content after they arrive. For quizzes it covers starts, completions, retakes, skipped questions, scores and return visits. It tells you whether your content holds attention, not just whether it gets seen.
What are the most important quiz engagement metrics?
What are the most important quiz engagement metrics?
What is a good quiz completion rate?
It depends on the quiz. Outgrow’s analysis of more than 10,000 experiences reports 85–95% for lead-generation quizzes and 25–45% for B2B assessments. Compare yourself against your own past results first.
How do I track quiz performance in WordPress?
Use a plugin that stores every attempt and summarizes it. In QuizPress, the dashboard shows total quizzes, attempts, users, average attempts and average score, plus top quizzes and a leaderboard. Each attempt can be opened for an answer-by-answer review.
Which WordPress quiz plugin has the best built-in analytics?
For built-in analytics, QuizPress is my pick because its dashboard, leaderboards, attempt review and survey/poll charts all ship in the plugin. Quiz and Survey Master offers deeper reporting, but according to its add-on pages that comes through separate paid add-ons such as Reporting and Analysis and Gradebook.
Can QuizPress export quiz results?
I did not find an attempt-results export in the version I reviewed. It does have a CSV import and export for questions. The latest release notes are the place to confirm whether that has changed.
Does QuizPress track anonymous visitors?
Anonymous (guest) attempts are a Pro capability. The leaderboards match attempts to registered users, so guests won’t appear in them.
How often should I review quiz statistics?
Weekly for a quick glance at attempts and the pending queue, and monthly for the deeper review and the log. Change one thing between reviews so you can see what worked.
Turn Your Quiz Data Into Better Quizzes
Engagement analytics is not about collecting more numbers. It is about knowing which quiz to fix next, and having the proof to back the decision.
QuizPress puts the numbers that matter in one clean place. You can see your best quizzes, your most loyal users and your weakest questions in minutes. The full feature list and the pricing page are worth a look, and every plan includes a 14-day money-back guarantee.
The one honest caveat is the one I gave earlier. If you need built-in results export or a gradebook today, that is where QuizPress is lighter than some competitors. If you want clarity about what your audience actually does, it’s the fastest way I know to get it.